
Format for a sign graph diagram
Purpose
This type of diagram was first used in the biological sciences in the early part of the Twentieth Century. They are used to represent and investigate the relationships between variables in a given situation and in particular to identify positive and negative feedback loops driving the system's behaviour. Hence it is good for thinking about the likely effects of changes and, in particular, of interventions in systems. A sign graph is often drawn to establish the structure of planned quantitative models. They can be developed directly from a multiple cause diagram.
Elements:
- phrases;
- arrows labelled with either a plus or minus sign;
- title.
Conventions
- The phrases (e.g. aaa, bbb, ccc, ddd, etc.) shown refer to variables (so phrases like number of cost of speed of level of are often found in these diagrams).
- The phrases should not themselves refer to variations (so do not use more/less or increase/decrease in the phrases).
- Use a minus sign by an arrow where a change in the variable at the tail of the arrow produces an opposite change in the variable at the head. So, in the figure above, an increase in ccc will lead to an decrease in ddd, and a decrease in ccc will lead to an increase in ddd (see guideline 2).
- Use a plus sign by an arrow where a change in the variable at the tail produces a similar change in the variable at the head. So, in the figure above, an increase in aaa will lead to an increase in ccc and a decrease in aaa will lead to a decrease in ccc (see guideline 2).
- A system boundary can be used but is usually not included.
- A title defining the system of interest is essential.
Guidelines
- Start off with the simplest diagram you can, and then elaborate it as necessary. In that way you can be sure that you understand the meaning and implications lif your diagram before it becomes too complex.
- When checking that you 've got the signs right on your arrows, it helps to read through the diagram asking Does more of (insert first variable) lead to more of (insert second variable)? in which case put a plus sign on the arrow or Does more (or less) of (insert first variable) lead to less (or more) of (insert second variable)? in which case use a minus sign on the arrow.
- Where there are loops of variables in the sign graph, you can check whether they represent positive or negative feedback loops by looking at the signs.
- First, check that it really is a continuous loop in which the arrows follow each other around the loop (i.e. all clockwise or all anti-clockwise).
- Then count the number of minus signs (it doesn't matter how many plus signs there are). If there is an odd number of minus signs (1, 3, 5 etc.) then it is a negative feedback loop. Otherwise it is a positive feedback loop.
- The figure above shows only two feedback loops: a positive feedback loop from aaa to ccc to bbb and back to aaa, and a negative feedback loop from ccc to bbb and back to ccc.
- The diagram can be built up from the end, as multiple-cause diagrams, or from a variable which you imagine to be very important following its ramifications.
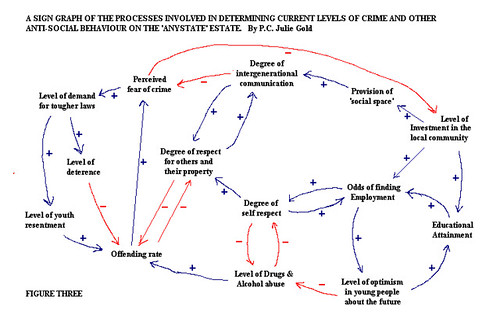
Examples of sign graph diagrams:
Content Source: http://systems.open.ac.uk/materials/T552/pages/sign/signAppendix.html
Image Source: http://farm4.static.flickr.com/3188/2813434207_5929423456.jpg
What would the advantages and disadvantages of sign graphs be?
ReplyDelete